Sunday, May 10, 2009

Interesting new pattern found in prime numbers

Prime numbers!

Image by cinderellasg via Flickr

A team of Spanish mathematicians, Bartolo Luque and Lucas Lacasa, found a new pattern in prime numbers that may have great repercussions in many fields such as cryptography and finance and fraud detection. The researchers found that the first digit distribution of prime numbers conforms to the Generalized Benford Law.

On a cryptography level, this may allow us to find big prime numbers faster or even help factoring prime number products; the basis of today’s cryptography.

Looking at the financial implications, the fraud detection properties can also apply to stock market analysis. As the team pointed out, naturally generated data will follow Benford’s law but randomly generated data or guessed data will not.

Reblog this post [with Zemanta]

Sunday, April 26, 2009

Update: Shorting both FAS and FAZ

fasfaz account aprilIt’s been a month since I posted my article about shorting both FAS and FAZ. I received many interesting comments and e-mails. The strategy has been working nicely but not as good as it has in the past. The short availability has been a problem in the morning: most of the time, my broker will not let me short either one of them. Waiting until noon usually shows enough shares available to short. Overall, the last 30 days produced a 3.6% gain including commissions.

Option strategies: Calendar spread

I’m back from my blog world vacation. I wasn’t drinking margaritas on the beach but mostly filing taxes for a few people and working overtime on an iPhone application for a demo in Boston last week. The markets have been quiet lately and this means it’s time for a few calendar spread option plays.

The calendar spread can be done using calls or puts, depending on the implied volatility bias and which side you anticipate the market to go. Calendar spreads are best suited when used in a stable market or during a period of consolidation. Using them on ETFs is a good way to avoid exposure to a single company. The call calendar spread is established by buying a long term call with at least 3 months to expiration and selling a short term call with less than 45 days to expiration, at the same strike price:

  • Long 1 call, at the money or slightly out of the money with more than 3 months to expiration
  • Short 1 call, at the same strike with less than 45 days to expiration

This strategy works by capturing the time decay on the short term option while protecting the position with a long term option. Also, when the short term option expires, it’s possible to sell an other short them call against the long term call to keep the position running.

Risk

The maximum risk for this strategy is the amount paid for the initial position. The maximum profit varies with the volatility. The break even prices are also determined by the volatility.

Entry rules

  • Implied volatility of the front month should be 15% higher than the IV of the bought call.
  • There is a price consolidation in the underlying stock.
  • Aim for a $2 debit per contract.

Exit rules

  • Close the position during the expiration week of the sold option or let the short expire worthless then sell long call on the next business day.
  • If you want to keep the position open, roll the short option forward during the expiration week if the long term purchased option still has over 2 months left to expiration.

Strategy graph

The performance graph for this position when bought:

call calendar spread initial

Performance graph at expiration:

call calendar spread

Volatility graph when bought:

call calendar spread volatility

Sunday, April 5, 2009

Market update: Financials over-optimism?

For the past few weeks, the financial market has been getting most of the attention between the Obama speeches. The U.S. President is working hard to “fix” the system and make the world a better place:

President Obama vowed Sunday to pursue the elimination of nuclear weapons from the planet, telling a cheering throng in Prague that the United States is ready to lead an international effort to reduce atomic arsenals and the threat they pose.

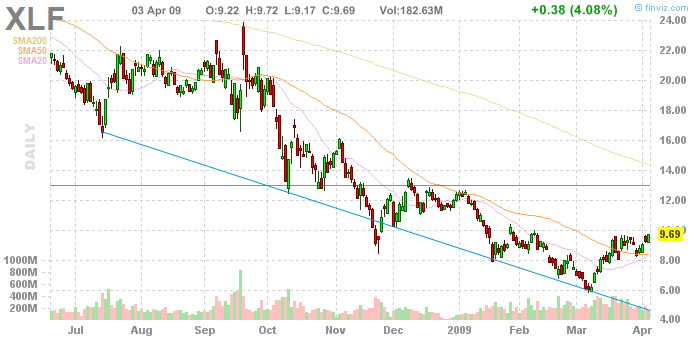
This quote from an article at L.A. Times by Christi Parsons and Tom Hamburger is very pleasing to the ear and may help bring stability and boost the market on Monday. But this series of good, great and better news interleaved with a rally in the financial sector may soon take us back to reality. Analysts are digesting the new rules like the “mark-to-market” accounting method that is supposed to save the Financials but may as well be an other evil plan ready to explode. Looking at the XLF ETF, it looks like the Financials are ripe for a pull-back in the next weeks:

The next week is going to be an interesting one: I’ll be watching FAZ closely.

Sunday, March 29, 2009

Option strategies: Long straddle

Back on the option trading strategies, today I’ll explain the long straddle. This strategy is initially Delta neutral, which means it doesn’t change a lot when the price stays the same. How is that profitable? When the underlying price changes a lot, either way, this strategy generates a profit. This position is also called a “long volatility trade”. This means it makes a profit when the underlying price volatility increases, even if the price doesn’t move, such as before a big event or earnings release.

The long straddle is formed using 1 call and 1 put at the same strike and same expiration:

  • Long 1 call, at the money
  • Long 1 put, at the money

Risk

The maximum risk for this strategy is the amount paid for the initial position. There are no margin requirements. The maximum profit you can get is unlimited on both sides. The upside breakeven price is the amount paid for the position plus the call strike price. The downside breakeven price is the put strike price minus the amount paid for the position.

Entry rules

  • Implied volatility should be lower than the historical volatility.
  • There is a price consolidation in the underlying stock.
  • If expecting a big move after earnings announcement or event, make sure the volatility isn’t too high when opening the position because volatility will drops dramatically after the event.
  • When buying before an event, try to enter the position 2 to 3 weeks before the release date, when option volatility is still low.
  • Make sure the stock has a history of high price movement after earnings announcements.

Exit rules

  • Close the position at least 20 trading days prior to expiration if there was no price movement.
  • Close the position after the earnings announcement or event. If the stock has moved a lot since the position was opened, consider closing the position right before the announcement because the stock may go back to where is was.
  • Close the position when a profit of 50% has been reached, considering opening cost of the position.

Strategy graph

The performance graph for this position when bought:

long straddle initial

Performance graph at expiration:

long straddle exp

Volatility graph when bought:

long straddle vol

Wednesday, March 25, 2009

Direxion to offer monthly 3x leveraged ETFs

image This is a follow up on my previous post about a trading strategy with FAS and FAZ, the Direxion Financial 300% ETFs. These two funds are tracking their index on a daily basis. This means a 10% drop today followed by a 10% rally tomorrow will NOT bring back the ETF to where it was. For example, if the fund started at $100, the 10% drop would bring it at $90. The next day, the 10% rally would bring it to $99, not $100 because 10% of $90 is only $9. In a volatile environment, this “eats” the fund’s value in a short time. But the value doesn’t really disappear… Direxion rebalances the funds everyday to make sure its value reflects the market, at 300% during the day.

To help longer term investors, Direxion will now offer similar funds with 2x and 3x leverage but tracking the index on a monthly basis. During the reference month, the value may drift away from the index value but should match the 200% or 300% return at the end of the month. In other words, this doesn’t replace the daily funds, it complements them. When more details are available about these new funds, I’ll see if I can find a strategy to trade the dailies with the monthlies.

Tuesday, March 24, 2009

Shorting both FAS and FAZ

I’ve been playing around with ETFs for a while and thought about a way to generate a considerable profit from them. Option traders are familiar with time decay but it also applies to leveraged ETFs. This ETF time decay is a result of the fund management fees, leverage financing interests and other expenses. Since November 2008, there are 2 interesting funds for this strategy: The Direxion Financial 3X ETFs. FAS is long the financial market and FAZ is short the financial market, both using 300% leverage. These ETFs are very popular and are traded in the tens of millions shares a day which make them good candidates for short selling.

While I was looking around for information on this strategy, some people rightfully said “they cannot go both to 0”. This may be true but that’s not the object of this strategy. Here, we want to re-hedge the positions daily to balance the dollar amount on FAS and FAZ. This way, we profit from the downward bias on both funds and we are hedged against the market since the net delta of this position is near 0 and readjusted to 0 every day.

The strategy is: everyday, at close time, balance the positions on FAS and FAZ to have the same short dollar amount resulting in a net delta of 0. A quick backtest starting with a short position of $5000 on each ETF shows:

Start amount $ 10,000.00
Gross profit $ 2,975.22
Fees ($0.005/share) $ 376.31
Days 125
Annual return % 87%
Annual return $ 8,687.64
Average win $ $ 107.06
Average loss $ $ (60.10)
Wins 48
Losses 36
Win % 57%

imageThese are some interesting results! Excluding slippage, and margin requirements, this would yield a compounded annual 87% return. If your broker allows it, you can put the money for the margin requirement in a T-bill for a small return on that unused amount. This clearly shows that holding FAS or FAZ long for more than a few days is a very bad idea: it will eat through your cash.

Note: I haven’t tested this strategy. If you are aware of any reason why it would not work, please let me know. As of this writing, the short availability for FAS and FAZ is around 400,000 shares each with my broker.

Update: I fixed the annual return percentage and amount calculations. The 126% figure was wrong. It actually is 87%.

Update 2: As pointed out by AJG, watch out for dividends. As a reminder, when you are short, you have to pay the dividend. Usually the stock will drop by the same amount as the dividend so this isn’t a big problem.

Sunday, March 22, 2009

Tapping into Twitter to feel the market

Image representing Twitter as depicted in Crun...

Image via CrunchBase

According to Chris Bennett at 97thfloor, Twitter may be the next big thing after Google. With reasons: Twitter takes the concept of short text status updates as seen on MSN Messenger, Facebook and others and expands the idea to make a global party line of endless chatter. How is that useful you ask? Twitter uses symbols to help categorize the content. For example, the hash symbol (#) is added in front of keywords to tag your subjects. You can also direct messages to specific users with the @ sign followed by their username. All this information can be accessed and searched on the Twitter search engine and many 3rd party search engines.

image Then comes StockTwits, a Twitter aggregator that uses the $ sign in front of stock ticker symbols to filter tweets on a specific company. Using this site, you can read real-time tweets about what’s happening and what other traders have to say about what you are trading. At the moment, the top tickers at StockTwits are FAZ and FAS, the Direxion Financial 3X ETFs. These channels are very active and can help you find trade ideas.

Reblog this post [with Zemanta]

Thursday, March 19, 2009

USDCAD retracing back to previous range

USDCADAfter testing the 1.3000 resistance, the USDCAD retraced back to the 1.22~1.27 range. The triangle pattern I wrote about a few weeks ago wasn’t confirmed and the currency pair is back to its multi-month range.

Crude Oil May09 FuturesThis Canadian dollars rally is fueled by raising crude oil prices, which is now trading at $51.70 per barrel for the May09 futures. This Canadian dollar rally may be short lived if the Retail Sales for January are down instead of the estimated raise of 1%.

Tuesday, March 17, 2009

Option strategies: Bear put spread

Following up on the option strategies posts, today I'll explain what is a Bear Put Spread. This strategy is a negative net Delta position; which means it profits when the underlying goes down... very handy these days! You want to enter this position at a top when the market is overbought or at a resistance level when you have a strong negative bias. If you haven't already, read my previous post on the Bull call spread because it covers some basic concepts that I will skip in this post.

The bear put spread is built using 2 put options at the same expiration date:

  • Long 1 put for the chosen strike price, usually at the money (ATM)
  • Short 1 put for a lower strike price, usually out of the money (OTM)

Risk

As with the Bull Call Spread, the maximum risk for the strategy is the amount paid for the spread. There are no margin requirements. The maximum profit you can get from a bear put spread is limited to the difference between the strikes minus the amount paid for the spread.

Entry rules

  • Bearish outlook for the underlying stock
  • Buy options with at least 30 trading days left before expiration
  • Aim for a 2:1 to 3:1 gain/risk ratio: about $1.25 to $1.65 for a $5 spread

Exit rules

  • Close position at least 20 trading days prior to expiration
  • Close position if value drops below 60% of initial purchase price
  • Close half the position when 100% profit achieved; Close the remaining half when the spread is valued at 80% of the total value of the spread ($4 for a $5 spread)

Strategy graph

The performance graph for this position when bought:

Performance graph at expiration:

Monday, March 9, 2009

Option strategies: Bull call spread

Option trading is often advertised as an "explosive" way to double your money every week... while it may be true if you are lucky, this is very misleading. It's true an option can triple value in a single day but it may also lose all its value in the same period. Albeit the perfect claim for the next "get rich quick" scheme, options should be used as a hedge for a stock portfolio or as a speculative tool when used correctly. Options can be used to gain when the market moves up, down, stays the same or even when it moves in any direction. All my option charts are generated using Option Oracle, the best free stock options strategy analysis tool.

I'll start this series of option trading strategies with the Bull Call Spread, also known as a Vertical Spread. This strategy is used to make a profit when the underlying stock goes up. Good entry points are: at a bottom, near a support level before earnings when you have a strong positive bias.

The bull call spread is composed of 2 call options at the same expiration date:

  • Long 1 call for the chosen strike price, usually at the money (ATM)
  • Short 1 call for a higher strike price, usually out of the money (OTM)

Risk

The maximum risk for the strategy is the amount paid for the spread. There are no margin requirements. The maximum profit you can get from a bull call spread is limited to the difference between the strikes minus the amount paid for the spread.

Entry rules

  • Bullish outlook for the underlying stock
  • Buy options with at least 30 trading days left before expiration
  • Aim for a 2:1 to 3:1 gain/risk ratio: about $1.25 to $1.65 for a $5 spread

Exit rules

  • Close position at least 20 trading days prior to expiration
  • Close position if value drops below 60% of initial purchase price
  • Close half the position when 100% profit achieved; Close the remaining half when the spread is valued at 80% of the total value of the spread ($4 for a $5 spread)

Strategy graph

To better understand option strategies, a performance graph is very helpful. The following is an example for an underlying currently at $68:

  • Long 1 Apr09 73 Call at 1.70
  • Short 1 Apr09 76 Call at 0.93

The total debit for this position is $0.77 with a maximum gain of $2.23. The gain/loss ratio is thus 2.9. This position's value changes at the same rate as 11 shares of the underlying for a fraction of the price, this is called Delta.

Note: Options are evaluated using values called Greeks: Delta, Gamma, Theta, Vega and Rho. I will describe them in another post.

The performance graph for this position when bought:

Performance graph at expiration:

Thursday, March 5, 2009

Monday, March 2, 2009

USDCAD broke out of a triangle pattern


After a catastrophic Canadian Gross Domestic Product for December and Quarterly Gross Domestic Product, it looks like the Canadian Dollar is going to fall during the months to come. Looking at the USDCAD chart, the pair broke out of a triangle pattern. A close above 1.30 would confirm the breakout and open the way to the 1.4000 ~ 1.4500 area. This is a good opportunity to buy a bull call spread on the CDD FX Index.

Sunday, March 1, 2009

Hello World!

Without making this post boring, I’ll skip the usual chat of the « Hello World » article and condense what I’ll be posting here. I’m a Computer Engineer with a day job and a not so secret interest in the stock market and, recently, the forex market. I mostly trade options but sometimes, I’ll work with the underlying. For the next few weeks I’ll post a series of articles about my favourite option trading strategies.